VFACTS: Record H1 as June sales slip
However, overall first-half sales are up 8.7 per cent (to 632,412 units), surpassing the previous record of 605,522 units set in 2018.
The Federal Chamber of Automotive Industries (FCAI) says the significant year-to-date milestone highlights the sustained demand for new vehicles across Australia, which is encouraging considering the ongoing economic challenges faced by consumers.
“The end of the financial year has traditionally been a strong month for vehicle sales and achieving 632,412 sales in just six months is a testament to the resilience of the market,” said FCAI chief executive Tony Weber.
Demand for SUVs and light commercial vehicles continues to drive the market, contributing 54.5 per cent and 23.3 per cent respectively to monthly sales figures.
The FCAI says the ongoing popularity of SUVs and light commercial vehicles demonstrates the versatility and practicality these vehicles offer to Australian consumers.
Key segment splits for June show SUV sales (65,248 units) ahead of light commercial vehicles (27,880), which in turn exceed passenger vehicle (21,065) and heavy commercial vehicle sales (5466).
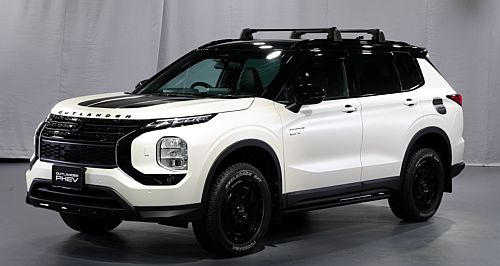
Ford’s Ranger was again the top-selling vehicle for the month with a tally of 6289 units (or 5.3 market share points). It led the Toyota HiLux (with 5630 units), Toyota RAV4 (3907), Mitsubishi Outlander (3045), and Tesla Model Y (2906).
Toyota was the market leader again in June with a total of 20,903 registrations for the month (or 17.5 per cent market share points). Toyota was followed by Ford (9493 units), Mazda (9483), Kia (8225), and Mitsubishi (7723).
So far this year, Toyota notched up 121,301 deliveries to earn a 19.2 per cent market share, followed by Ford in distant second place with 49,622 units and a 7.8 per cent share.
Both brands are up significantly year-on-year, with Toyota sales 31.6 per cent higher than the first half of 2023 and Ford 30 per cent ahead.
Mazda’s first-half sales dipped 3.7 per cent to place third YTD with 48,547 sales and a 7.7 per cent slice of the pie with Kia up 5.5 per cent to take fourth position on 41,300 units (6.5 per cent share). Mitsubishi has been on a tear, up 28.5 per cent YTD and rounded out the top five with 39,634 sales and a 6.3 per cent share.
Interestingly, hybrid and plug-in hybrid vehicle sales have seen a notable increase in market share, capturing 14.4 per cent of the market compared with 7.8 per cent at this time last year and reflecting a growing customer preference for more sustainable vehicle options.
Against these options, battery electric vehicle market share was down slightly against the same time last year, reflecting global trends.
“Battery electric vehicles (BEVs) saw a slight decrease in sales accounting for 8.0 per cent of new sales, down from 8.8 per cent at the same month last year,” said Mr Weber.
However, Australia has experienced an overall increase in BEV sales year-to-date, accounting for 50,219 yearly sales compared with 43,092 at the same time last year, representing 16.5 per cent growth against the overall market’s 8.7 per cent surge.
“We hope to break the significant milestone of 100,000 EV sales in 2024,” added Mr Weber.
By comparison hybrid sales YTD are up 113.3 per cent and PHEVs are up 129.6 per cent.
Across jurisdictions, the Australian Capital Territory recorded the same new car sales total as this time last year (1856), but all other states and territories were down.
Western Australia decreased most significantly with 12,079 unit sales for the month of June (down 7.6 per cent) followed by Queensland with 26,265 unit sales (down 6.3 per cent), the Northern Territory 1028 unit sales (down 5.3 per cent), Victoria 32,256 unit sales (down 4.7 per cent), New South Wales 36,246 unit sales (down 2.1 per cent), Tasmania 1897 unit sales (down 1.4 per cent), and South Australia 7932 unit sales (down 0.5 per cent).
Top 10 vehicle sales by make (June 2024):
|
Make |
Sales |
Share |
|
Toyota |
20,903 |
17.5% |
|
Ford |
9493 |
7.9% |
|
Mazda |
9483 |
7.9% |
|
Kia |
8225 |
6.9% |
|
Mitsubishi |
7723 |
6.5% |
|
Hyundai |
6552 |
5.5% |
|
Tesla |
4683 |
3.9% |
|
Subaru |
4460 |
3.7% |
|
Isuzu Ute |
4445 |
3.7% |
|
Nissan |
4293 |
3.6% |
Top 10 vehicle sales by model (June 2024):
|
Make/Model |
Sales |
Variance |
|
Ford Ranger |
6289 |
+17.9% |
|
Toyota HiLux |
5630 |
-8.3% |
|
Toyota RAV4 |
3907 |
+36.7% |
|
Mitsubishi Outlander |
3045 |
+87.5% |
|
Tesla Model Y |
2906 |
-47.7% |
|
Isuzu Ute D-Max |
2881 |
+15.2% |
|
Mazda CX-5 |
2687 |
+48.3% |
|
Toyota LandCruiser |
2457 |
-9.8% |
|
Ford Everest |
2267 |
+96.6% |
|
Toyota Corolla |
2232 |
+31.1% |
State by state (June 2024):
|
State |
Sales |
Variance |
|
ACT |
1856 |
+/-0.0% |
|
NSW |
36,246 |
-2.1% |
|
NT |
1028 |
-5.3% |
|
QLD |
26,265 |
-6.3% |
|
SA |
7932 |
-0.5% |
|
TAS |
1897 |
-1.4% |
|
VIC |
32,356 |
-4.7% |
|
WA |
12,079 |
-7.6% |
*All data supplied courtesy of the FCAI.